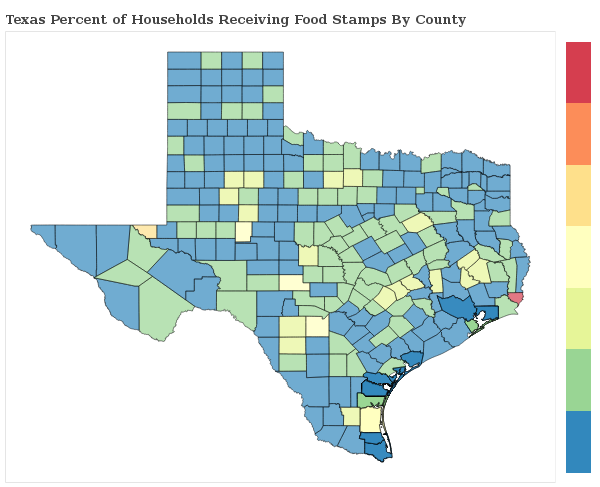
1.1% of Households Receive Food Stamps in San Antonio, Texas
Food Stamps in San Antonio, Texas
What percent of Households Receive Food Stamps in San Antonio?
The percentage of households receiving food stamps in the last year in San Antonio is 1.1%.
How Many Households in San Antonio Receive Food Stamps?
There are 5658 households out of 494260 in San Antonio receiving food stamps.
Where does San Antonio Rank in Comparison to Other Texas Cities for HouseHolds Receiving Food Stamps?
San Antonio ranks 505th out of 983 cities and towns in Texas for the least number of households receiving food stamps. A smaller numeric rank indicates a lower percentage of homes receive food stamps.
Here is a comparison of Food Stamps by city(minimum 1,000 residents) in Bexar County, Comal County, Medina County.
| City | Food Stamps | Details |
|---|---|---|
Alamo Heights |
1.5% |
50 of 3,226 Alamo Heights households received food stamps within the past year. |
Balcones Heights |
2.2% |
31 of 1,395 Balcones Heights households received food stamps within the past year. |
Castle Hills |
0.5% |
9 of 1,742 Castle Hills households received food stamps within the past year. |
China Grove |
0.0% |
0 of 423 China Grove households received food stamps within the past year. |
Converse |
1.1% |
76 of 6,665 Converse households received food stamps within the past year. |
Cross Mountain |
0.0% |
0 of 1,249 Cross Mountain households received food stamps within the past year. |
Helotes |
2.4% |
65 of 2,655 Helotes households received food stamps within the past year. |
Hollywood Park |
0.9% |
12 of 1,393 Hollywood Park households received food stamps within the past year. |
Kirby |
0.5% |
15 of 3,168 Kirby households received food stamps within the past year. |
Lackland AFB |
0.0% |
0 of 412 Lackland AFB households received food stamps within the past year. |
Leon Valley |
1.0% |
43 of 4,131 Leon Valley households received food stamps within the past year. |
Live Oak |
0.6% |
35 of 6,228 Live Oak households received food stamps within the past year. |
Olmos Park |
0.4% |
3 of 770 Olmos Park households received food stamps within the past year. |
Randolph AFB |
0.7% |
2 of 267 Randolph AFB households received food stamps within the past year. |
St. Hedwig |
0.6% |
4 of 672 St. Hedwig households received food stamps within the past year. |
Scenic Oaks |
0.5% |
9 of 1,716 Scenic Oaks households received food stamps within the past year. |
Shavano Park |
2.3% |
28 of 1,224 Shavano Park households received food stamps within the past year. |
Somerset |
1.9% |
8 of 432 Somerset households received food stamps within the past year. |
Terrell Hills |
0.0% |
0 of 1,783 Terrell Hills households received food stamps within the past year. |
Timberwood Park |
2.4% |
194 of 8,071 Timberwood Park households received food stamps within the past year. |
Universal City |
1.2% |
87 of 7,414 Universal City households received food stamps within the past year. |
Von Ormy |
0.9% |
3 of 334 Von Ormy households received food stamps within the past year. |
Windcrest |
0.0% |
0 of 2,183 Windcrest households received food stamps within the past year. |
