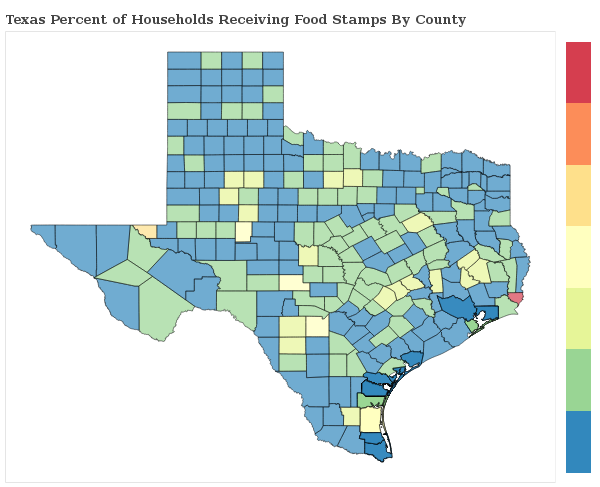
1.1% of Households Receive Food Stamps in Lewisville, Texas
Food Stamps in Lewisville, Texas
What percent of Households Receive Food Stamps in Lewisville?
The percentage of households receiving food stamps in the last year in Lewisville is 1.1%.
How Many Households in Lewisville Receive Food Stamps?
There are 413 households out of 38719 in Lewisville receiving food stamps.
Where does Lewisville Rank in Comparison to Other Texas Cities for HouseHolds Receiving Food Stamps?
Lewisville ranks 478th out of 983 cities and towns in Texas for the least number of households receiving food stamps. A smaller numeric rank indicates a lower percentage of homes receive food stamps.
Here is a comparison of Food Stamps by city(minimum 1,000 residents) in Dallas County, Denton County.
| City | Food Stamps | Details |
|---|---|---|
Addison |
0.3% |
30 of 8,607 Addison households received food stamps within the past year. |
Balch Springs |
1.8% |
116 of 6,524 Balch Springs households received food stamps within the past year. |
Cockrell Hill |
1.1% |
13 of 1,142 Cockrell Hill households received food stamps within the past year. |
DeSoto |
1.2% |
230 of 19,328 DeSoto households received food stamps within the past year. |
Duncanville |
1.3% |
170 of 13,333 Duncanville households received food stamps within the past year. |
Farmers Branch |
0.8% |
96 of 12,565 Farmers Branch households received food stamps within the past year. |
Highland Park |
1.4% |
50 of 3,570 Highland Park households received food stamps within the past year. |
Hutchins |
1.2% |
14 of 1,184 Hutchins households received food stamps within the past year. |
Irving |
0.9% |
739 of 84,388 Irving households received food stamps within the past year. |
Lancaster |
1.8% |
232 of 12,892 Lancaster households received food stamps within the past year. |
Sunnyvale |
2.8% |
50 of 1,793 Sunnyvale households received food stamps within the past year. |
University Park |
1.3% |
100 of 7,510 University Park households received food stamps within the past year. |
Wilmer |
0.0% |
0 of 1,084 Wilmer households received food stamps within the past year. |
