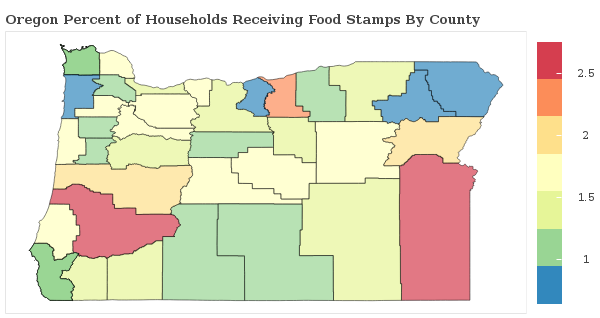
1.1% of Households Receive Food Stamps in Beaverton, Oregon
Food Stamps in Beaverton, Oregon
What percent of Households Receive Food Stamps in Beaverton?
The percentage of households receiving food stamps in the last year in Beaverton is 1.1%.
How Many Households in Beaverton Receive Food Stamps?
There are 424 households out of 38855 in Beaverton receiving food stamps.
Where does Beaverton Rank in Comparison to Other Oregon Cities for HouseHolds Receiving Food Stamps?
Beaverton ranks 80th out of 210 cities and towns in Oregon for the least number of households receiving food stamps. A smaller numeric rank indicates a lower percentage of homes receive food stamps.
How do other cities in Washington County compare to Beaverton when it comes to the percentage of homes receiving Food Stamps?
Cities must have a minimum of 1,000 residents to qualify
| City | Food Stamps | Details |
|---|---|---|
Aloha |
1.0% |
186 of 17,846 Aloha households received food stamps within the past year. |
Banks |
0.6% |
3 of 506 Banks households received food stamps within the past year. |
Beaverton |
1.1% |
424 of 38,855 Beaverton households received food stamps within the past year. |
Bethany |
0.3% |
25 of 8,048 Bethany households received food stamps within the past year. |
Bull Mountain |
1.2% |
38 of 3,219 Bull Mountain households received food stamps within the past year. |
Cedar Hills |
1.4% |
49 of 3,438 Cedar Hills households received food stamps within the past year. |
Cornelius |
2.3% |
80 of 3,438 Cornelius households received food stamps within the past year. |
Durham |
1.6% |
10 of 622 Durham households received food stamps within the past year. |
Forest Grove |
1.1% |
85 of 7,955 Forest Grove households received food stamps within the past year. |
Garden Home-Whitford |
0.3% |
9 of 2,702 Garden Home-Whitford households received food stamps within the past year. |
Hillsboro |
1.2% |
435 of 37,424 Hillsboro households received food stamps within the past year. |
King City |
2.3% |
45 of 1,946 King City households received food stamps within the past year. |
Metzger |
0.0% |
0 of 1,641 Metzger households received food stamps within the past year. |
North Plains |
1.2% |
9 of 770 North Plains households received food stamps within the past year. |
Oak Hills |
0.6% |
25 of 4,218 Oak Hills households received food stamps within the past year. |
Raleigh Hills |
1.7% |
46 of 2,652 Raleigh Hills households received food stamps within the past year. |
Rockcreek |
0.4% |
15 of 3,528 Rockcreek households received food stamps within the past year. |
Sherwood |
1.7% |
112 of 6,479 Sherwood households received food stamps within the past year. |
Tigard |
1.1% |
223 of 20,421 Tigard households received food stamps within the past year. |
West Slope |
2.2% |
69 of 3,118 West Slope households received food stamps within the past year. |
