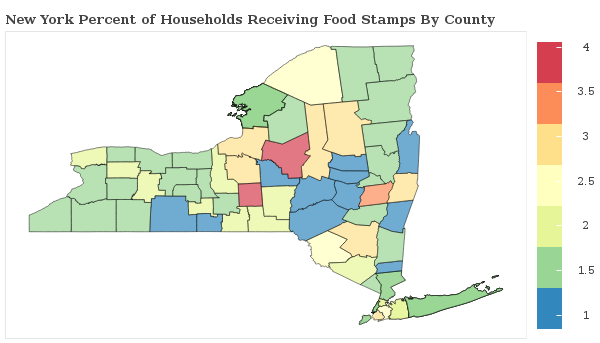
4.1% of Households Receive Food Stamps in Syracuse, New York
Food Stamps in Syracuse, New York
What percent of Households Receive Food Stamps in Syracuse?
The percentage of households receiving food stamps in the last year in Syracuse is 4.1%.
How Many Households in Syracuse Receive Food Stamps?
There are 2281 households out of 55633 in Syracuse receiving food stamps.
Where does Syracuse Rank in Comparison to Other New York Cities for HouseHolds Receiving Food Stamps?
Syracuse ranks 750th out of 809 cities and towns in New York for the least number of households receiving food stamps. A smaller numeric rank indicates a lower percentage of homes receive food stamps.
How do other cities in Onondaga County compare to Syracuse when it comes to the percentage of homes receiving Food Stamps?
Cities must have a minimum of 1,000 residents to qualify
| City | Food Stamps | Details |
|---|---|---|
Baldwinsville |
2.0% |
66 of 3,263 Baldwinsville households received food stamps within the past year. |
Camillus |
6.0% |
33 of 549 Camillus households received food stamps within the past year. |
East Syracuse |
3.4% |
46 of 1,347 East Syracuse households received food stamps within the past year. |
Elbridge |
2.5% |
10 of 393 Elbridge households received food stamps within the past year. |
Fairmount |
1.7% |
72 of 4,214 Fairmount households received food stamps within the past year. |
Fayetteville |
0.9% |
17 of 1,803 Fayetteville households received food stamps within the past year. |
Galeville |
3.4% |
70 of 2,039 Galeville households received food stamps within the past year. |
Jordan |
2.3% |
13 of 577 Jordan households received food stamps within the past year. |
Lakeland |
2.8% |
29 of 1,026 Lakeland households received food stamps within the past year. |
Liverpool |
0.7% |
8 of 1,144 Liverpool households received food stamps within the past year. |
Lyncourt |
2.3% |
40 of 1,712 Lyncourt households received food stamps within the past year. |
Manlius |
0.0% |
0 of 1,917 Manlius households received food stamps within the past year. |
Marcellus |
1.7% |
13 of 756 Marcellus households received food stamps within the past year. |
Mattydale |
6.3% |
162 of 2,581 Mattydale households received food stamps within the past year. |
Minoa |
8.1% |
110 of 1,360 Minoa households received food stamps within the past year. |
Nedrow |
3.3% |
31 of 937 Nedrow households received food stamps within the past year. |
North Syracuse |
0.6% |
17 of 2,964 North Syracuse households received food stamps within the past year. |
Seneca Knolls |
6.6% |
64 of 971 Seneca Knolls households received food stamps within the past year. |
Skaneateles |
0.0% |
0 of 1,164 Skaneateles households received food stamps within the past year. |
Solvay |
0.7% |
21 of 2,930 Solvay households received food stamps within the past year. |
Syracuse |
4.1% |
2281 of 55,633 Syracuse households received food stamps within the past year. |
Tully |
5.5% |
24 of 433 Tully households received food stamps within the past year. |
Village Green |
0.7% |
13 of 1,880 Village Green households received food stamps within the past year. |
Westvale |
1.8% |
37 of 2,022 Westvale households received food stamps within the past year. |
