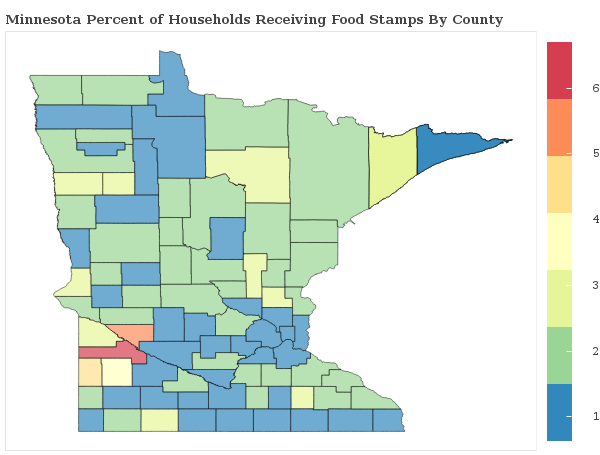
1.7% of Households Receive Food Stamps in Woodbury, Minnesota
Food Stamps in Woodbury, Minnesota
What percent of Households Receive Food Stamps in Woodbury?
The percentage of households receiving food stamps in the last year in Woodbury is 1.7%.
How Many Households in Woodbury Receive Food Stamps?
There are 416 households out of 24443 in Woodbury receiving food stamps.
Where does Woodbury Rank in Comparison to Other Minnesota Cities for HouseHolds Receiving Food Stamps?
Woodbury ranks 225th out of 361 cities and towns in Minnesota for the least number of households receiving food stamps. A smaller numeric rank indicates a lower percentage of homes receive food stamps.
How do other cities in Washington County compare to Woodbury when it comes to the percentage of homes receiving Food Stamps?
Cities must have a minimum of 1,000 residents to qualify
| City | Food Stamps | Details |
|---|---|---|
Bayport |
2.1% |
19 of 897 Bayport households received food stamps within the past year. |
Afton |
1.1% |
12 of 1,133 Afton households received food stamps within the past year. |
Cottage Grove |
1.1% |
127 of 12,011 Cottage Grove households received food stamps within the past year. |
Dellwood |
3.3% |
13 of 389 Dellwood households received food stamps within the past year. |
Forest Lake |
1.4% |
106 of 7,332 Forest Lake households received food stamps within the past year. |
Grant |
1.3% |
20 of 1,530 Grant households received food stamps within the past year. |
Hugo |
2.1% |
113 of 5,293 Hugo households received food stamps within the past year. |
Lake Elmo |
0.9% |
26 of 2,985 Lake Elmo households received food stamps within the past year. |
Lakeland |
0.8% |
6 of 746 Lakeland households received food stamps within the past year. |
Mahtomedi |
2.1% |
63 of 2,982 Mahtomedi households received food stamps within the past year. |
Newport |
0.0% |
0 of 1,331 Newport households received food stamps within the past year. |
Oakdale |
1.2% |
134 of 11,207 Oakdale households received food stamps within the past year. |
Oak Park Heights |
1.1% |
24 of 2,188 Oak Park Heights households received food stamps within the past year. |
St. Paul Park |
1.7% |
35 of 2,034 St. Paul Park households received food stamps within the past year. |
Scandia |
0.4% |
6 of 1,415 Scandia households received food stamps within the past year. |
Stillwater |
1.1% |
78 of 7,339 Stillwater households received food stamps within the past year. |
Woodbury |
1.7% |
416 of 24,443 Woodbury households received food stamps within the past year. |
