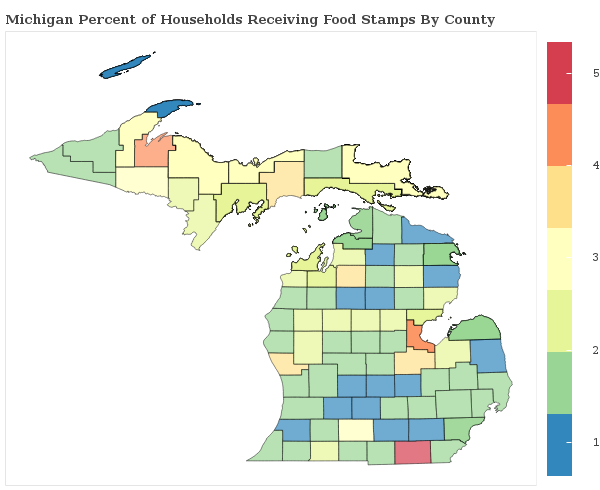
1.2% of Households Receive Food Stamps in Troy, Michigan
Food Stamps in Troy, Michigan
What percent of Households Receive Food Stamps in Troy?
The percentage of households receiving food stamps in the last year in Troy is 1.2%.
How Many Households in Troy Receive Food Stamps?
There are 384 households out of 31520 in Troy receiving food stamps.
Where does Troy Rank in Comparison to Other Michigan Cities for HouseHolds Receiving Food Stamps?
Troy ranks 159th out of 428 cities and towns in Michigan for the least number of households receiving food stamps. A smaller numeric rank indicates a lower percentage of homes receive food stamps.
How do other cities in Oakland County compare to Troy when it comes to the percentage of homes receiving Food Stamps?
Cities must have a minimum of 1,000 residents to qualify
| City | Food Stamps | Details |
|---|---|---|
Auburn Hills |
1.8% |
168 of 9,235 Auburn Hills households received food stamps within the past year. |
Berkley |
2.0% |
127 of 6,504 Berkley households received food stamps within the past year. |
Beverly Hills |
1.1% |
44 of 4,142 Beverly Hills households received food stamps within the past year. |
Bingham Farms |
0.6% |
3 of 511 Bingham Farms households received food stamps within the past year. |
Birmingham |
0.8% |
76 of 8,982 Birmingham households received food stamps within the past year. |
Bloomfield Hills |
1.8% |
23 of 1,292 Bloomfield Hills households received food stamps within the past year. |
Clawson |
1.5% |
82 of 5,652 Clawson households received food stamps within the past year. |
Farmington |
2.1% |
101 of 4,717 Farmington households received food stamps within the past year. |
Farmington Hills |
1.6% |
557 of 34,377 Farmington Hills households received food stamps within the past year. |
Ferndale |
1.9% |
184 of 9,909 Ferndale households received food stamps within the past year. |
Franklin |
0.0% |
0 of 1,151 Franklin households received food stamps within the past year. |
Hazel Park |
2.2% |
157 of 7,107 Hazel Park households received food stamps within the past year. |
Holly |
0.6% |
15 of 2,459 Holly households received food stamps within the past year. |
Huntington Woods |
0.4% |
9 of 2,447 Huntington Woods households received food stamps within the past year. |
Keego Harbor |
0.0% |
0 of 1,512 Keego Harbor households received food stamps within the past year. |
Lake Orion |
1.4% |
18 of 1,305 Lake Orion households received food stamps within the past year. |
Lathrup Village |
1.3% |
20 of 1,541 Lathrup Village households received food stamps within the past year. |
Madison Heights |
2.9% |
377 of 12,868 Madison Heights households received food stamps within the past year. |
Milford |
0.5% |
13 of 2,695 Milford households received food stamps within the past year. |
Novi |
1.3% |
297 of 22,770 Novi households received food stamps within the past year. |
Oak Park |
2.7% |
311 of 11,601 Oak Park households received food stamps within the past year. |
Orchard Lake Village |
1.8% |
15 of 855 Orchard Lake Village households received food stamps within the past year. |
Ortonville |
0.0% |
0 of 611 Ortonville households received food stamps within the past year. |
Oxford |
0.6% |
9 of 1,505 Oxford households received food stamps within the past year. |
Pleasant Ridge |
2.2% |
23 of 1,058 Pleasant Ridge households received food stamps within the past year. |
Pontiac |
1.8% |
425 of 23,262 Pontiac households received food stamps within the past year. |
Rochester |
0.5% |
26 of 5,461 Rochester households received food stamps within the past year. |
Rochester Hills |
1.3% |
363 of 28,468 Rochester Hills households received food stamps within the past year. |
Royal Oak |
1.6% |
470 of 28,548 Royal Oak households received food stamps within the past year. |
Southfield |
2.0% |
631 of 32,333 Southfield households received food stamps within the past year. |
South Lyon |
0.9% |
42 of 4,902 South Lyon households received food stamps within the past year. |
Sylvan Lake |
0.5% |
4 of 846 Sylvan Lake households received food stamps within the past year. |
Troy |
1.2% |
384 of 31,520 Troy households received food stamps within the past year. |
Walled Lake |
0.0% |
0 of 3,442 Walled Lake households received food stamps within the past year. |
Wixom |
0.8% |
51 of 6,189 Wixom households received food stamps within the past year. |
Wolverine Lake |
0.9% |
17 of 1,822 Wolverine Lake households received food stamps within the past year. |
