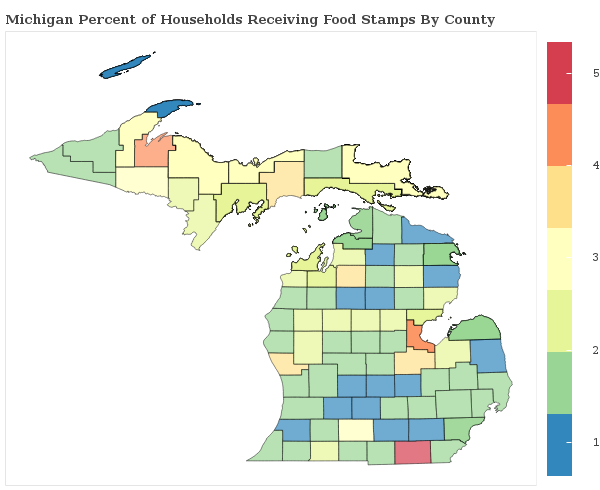
1.2% of Households Receive Food Stamps in Dearborn, Michigan
Food Stamps in Dearborn, Michigan
What percent of Households Receive Food Stamps in Dearborn?
The percentage of households receiving food stamps in the last year in Dearborn is 1.2%.
How Many Households in Dearborn Receive Food Stamps?
There are 382 households out of 30814 in Dearborn receiving food stamps.
Where does Dearborn Rank in Comparison to Other Michigan Cities for HouseHolds Receiving Food Stamps?
Dearborn ranks 161st out of 428 cities and towns in Michigan for the least number of households receiving food stamps. A smaller numeric rank indicates a lower percentage of homes receive food stamps.
How do other cities in Wayne County compare to Dearborn when it comes to the percentage of homes receiving Food Stamps?
Cities must have a minimum of 1,000 residents to qualify
| City | Food Stamps | Details |
|---|---|---|
Allen Park |
0.8% |
87 of 10,928 Allen Park households received food stamps within the past year. |
Belleville |
3.7% |
64 of 1,739 Belleville households received food stamps within the past year. |
Dearborn |
1.2% |
382 of 30,814 Dearborn households received food stamps within the past year. |
Dearborn Heights |
2.3% |
463 of 20,483 Dearborn Heights households received food stamps within the past year. |
Detroit |
2.5% |
6366 of 258,471 Detroit households received food stamps within the past year. |
Ecorse |
6.0% |
221 of 3,696 Ecorse households received food stamps within the past year. |
Garden City |
1.8% |
184 of 10,500 Garden City households received food stamps within the past year. |
Gibraltar |
1.6% |
28 of 1,804 Gibraltar households received food stamps within the past year. |
Grosse Pointe |
0.4% |
9 of 2,212 Grosse Pointe households received food stamps within the past year. |
Grosse Pointe Farms |
0.1% |
3 of 3,113 Grosse Pointe Farms households received food stamps within the past year. |
Grosse Pointe Park |
1.3% |
57 of 4,238 Grosse Pointe Park households received food stamps within the past year. |
Grosse Pointe Woods |
1.1% |
67 of 6,024 Grosse Pointe Woods households received food stamps within the past year. |
Hamtramck |
2.1% |
130 of 6,158 Hamtramck households received food stamps within the past year. |
Harper Woods |
1.8% |
94 of 5,199 Harper Woods households received food stamps within the past year. |
Highland Park |
3.1% |
141 of 4,523 Highland Park households received food stamps within the past year. |
Inkster |
2.8% |
262 of 9,348 Inkster households received food stamps within the past year. |
Lincoln Park |
1.6% |
233 of 14,408 Lincoln Park households received food stamps within the past year. |
Livonia |
1.6% |
585 of 37,186 Livonia households received food stamps within the past year. |
Melvindale |
1.9% |
71 of 3,769 Melvindale households received food stamps within the past year. |
Plymouth |
1.2% |
51 of 4,208 Plymouth households received food stamps within the past year. |
River Rouge |
6.5% |
182 of 2,821 River Rouge households received food stamps within the past year. |
Riverview |
0.7% |
38 of 5,067 Riverview households received food stamps within the past year. |
Rockwood |
1.7% |
23 of 1,341 Rockwood households received food stamps within the past year. |
Romulus |
1.3% |
111 of 8,585 Romulus households received food stamps within the past year. |
Southgate |
1.4% |
176 of 12,650 Southgate households received food stamps within the past year. |
Taylor |
1.8% |
430 of 23,666 Taylor households received food stamps within the past year. |
Trenton |
1.4% |
109 of 7,841 Trenton households received food stamps within the past year. |
Wayne |
1.6% |
108 of 6,622 Wayne households received food stamps within the past year. |
Westland |
1.4% |
476 of 35,107 Westland households received food stamps within the past year. |
Woodhaven |
0.8% |
39 of 5,148 Woodhaven households received food stamps within the past year. |
Wyandotte |
1.0% |
116 of 11,113 Wyandotte households received food stamps within the past year. |
