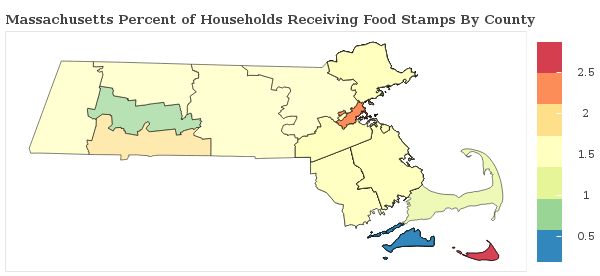
2.6% of Households Receive Food Stamps in Springfield, Massachusetts
Food Stamps in Springfield, Massachusetts
What percent of Households Receive Food Stamps in Springfield?
The percentage of households receiving food stamps in the last year in Springfield is 2.6%.
How Many Households in Springfield Receive Food Stamps?
There are 1478 households out of 56331 in Springfield receiving food stamps.
Where does Springfield Rank in Comparison to Other Massachusetts Cities for HouseHolds Receiving Food Stamps?
Springfield ranks 197th out of 224 cities and towns in Massachusetts for the least number of households receiving food stamps. A smaller numeric rank indicates a lower percentage of homes receive food stamps.
How do other cities in Hampden County compare to Springfield when it comes to the percentage of homes receiving Food Stamps?
Cities must have a minimum of 1,000 residents to qualify
| City | Food Stamps | Details |
|---|---|---|
Monson Center |
1.0% |
8 of 833 Monson Center households received food stamps within the past year. |
Agawam Town |
1.7% |
198 of 11,750 Agawam Town households received food stamps within the past year. |
Chicopee |
1.5% |
336 of 22,987 Chicopee households received food stamps within the past year. |
Palmer Town |
0.7% |
37 of 4,936 Palmer Town households received food stamps within the past year. |
Springfield |
2.6% |
1478 of 56,331 Springfield households received food stamps within the past year. |
Westfield |
2.6% |
398 of 15,276 Westfield households received food stamps within the past year. |
West Springfield Town |
2.1% |
247 of 11,971 West Springfield Town households received food stamps within the past year. |
Wilbraham |
1.9% |
24 of 1,241 Wilbraham households received food stamps within the past year. |
Holland |
3.9% |
21 of 541 Holland households received food stamps within the past year. |
Holyoke |
1.4% |
220 of 15,403 Holyoke households received food stamps within the past year. |
Longmeadow |
1.6% |
92 of 5,694 Longmeadow households received food stamps within the past year. |
