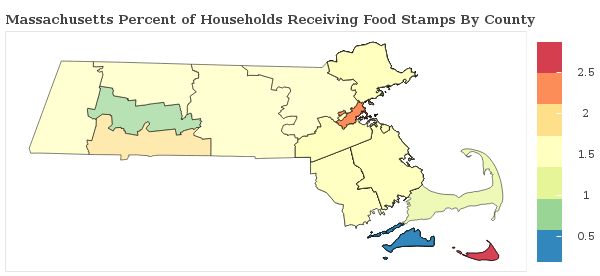
1.8% of Households Receive Food Stamps in Quincy, Massachusetts
Food Stamps in Quincy, Massachusetts
What percent of Households Receive Food Stamps in Quincy?
The percentage of households receiving food stamps in the last year in Quincy is 1.8%.
How Many Households in Quincy Receive Food Stamps?
There are 712 households out of 40167 in Quincy receiving food stamps.
Where does Quincy Rank in Comparison to Other Massachusetts Cities for HouseHolds Receiving Food Stamps?
Quincy ranks 148th out of 224 cities and towns in Massachusetts for the least number of households receiving food stamps. A smaller numeric rank indicates a lower percentage of homes receive food stamps.
How do other cities in Norfolk County compare to Quincy when it comes to the percentage of homes receiving Food Stamps?
Cities must have a minimum of 1,000 residents to qualify
| City | Food Stamps | Details |
|---|---|---|
Medfield |
1.3% |
32 of 2,426 Medfield households received food stamps within the past year. |
Millis-Clicquot |
4.0% |
72 of 1,821 Millis-Clicquot households received food stamps within the past year. |
Milton |
1.2% |
105 of 8,970 Milton households received food stamps within the past year. |
Needham |
1.4% |
144 of 10,652 Needham households received food stamps within the past year. |
Bellingham |
0.7% |
14 of 2,106 Bellingham households received food stamps within the past year. |
Braintree Town |
1.7% |
238 of 14,017 Braintree Town households received food stamps within the past year. |
Brookline |
1.0% |
235 of 24,716 Brookline households received food stamps within the past year. |
Dedham |
2.4% |
237 of 9,872 Dedham households received food stamps within the past year. |
Dover |
0.0% |
0 of 833 Dover households received food stamps within the past year. |
Foxborough |
0.7% |
17 of 2,429 Foxborough households received food stamps within the past year. |
Franklin Town |
1.0% |
113 of 11,288 Franklin Town households received food stamps within the past year. |
Norwood |
1.5% |
171 of 11,757 Norwood households received food stamps within the past year. |
Quincy |
1.8% |
712 of 40,167 Quincy households received food stamps within the past year. |
Randolph |
3.6% |
442 of 12,192 Randolph households received food stamps within the past year. |
Sharon |
2.5% |
50 of 1,975 Sharon households received food stamps within the past year. |
Walpole |
1.1% |
27 of 2,441 Walpole households received food stamps within the past year. |
Wellesley |
2.2% |
187 of 8,658 Wellesley households received food stamps within the past year. |
Weymouth Town |
2.1% |
479 of 23,014 Weymouth Town households received food stamps within the past year. |
Holbrook |
1.2% |
50 of 4,291 Holbrook households received food stamps within the past year. |
