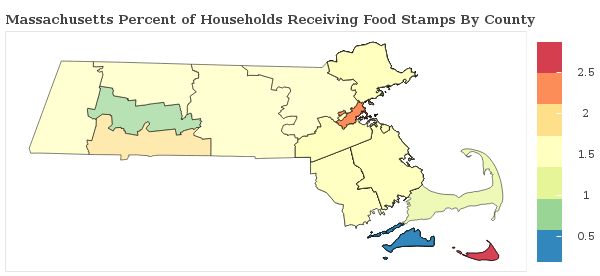
1.3% of Households Receive Food Stamps in Lynn, Massachusetts
Food Stamps in Lynn, Massachusetts
What percent of Households Receive Food Stamps in Lynn?
The percentage of households receiving food stamps in the last year in Lynn is 1.3%.
How Many Households in Lynn Receive Food Stamps?
There are 445 households out of 32981 in Lynn receiving food stamps.
Where does Lynn Rank in Comparison to Other Massachusetts Cities for HouseHolds Receiving Food Stamps?
Lynn ranks 106th out of 224 cities and towns in Massachusetts for the least number of households receiving food stamps. A smaller numeric rank indicates a lower percentage of homes receive food stamps.
How do other cities in Essex County compare to Lynn when it comes to the percentage of homes receiving Food Stamps?
Cities must have a minimum of 1,000 residents to qualify
| City | Food Stamps | Details |
|---|---|---|
Marblehead |
1.0% |
80 of 8,250 Marblehead households received food stamps within the past year. |
Methuen Town |
1.4% |
240 of 17,665 Methuen Town households received food stamps within the past year. |
Nahant |
1.8% |
28 of 1,597 Nahant households received food stamps within the past year. |
Newburyport |
1.2% |
92 of 7,881 Newburyport households received food stamps within the past year. |
Amesbury Town |
2.0% |
143 of 7,025 Amesbury Town households received food stamps within the past year. |
Andover |
0.5% |
16 of 3,373 Andover households received food stamps within the past year. |
Beverly |
1.4% |
229 of 16,408 Beverly households received food stamps within the past year. |
Boxford |
3.2% |
26 of 816 Boxford households received food stamps within the past year. |
Danvers |
1.2% |
128 of 10,624 Danvers households received food stamps within the past year. |
Essex |
0.0% |
0 of 525 Essex households received food stamps within the past year. |
Peabody |
1.4% |
308 of 21,467 Peabody households received food stamps within the past year. |
Rockport |
0.7% |
16 of 2,231 Rockport households received food stamps within the past year. |
Rowley |
3.2% |
20 of 625 Rowley households received food stamps within the past year. |
Salem |
1.3% |
230 of 18,294 Salem households received food stamps within the past year. |
Salisbury |
2.1% |
45 of 2,187 Salisbury households received food stamps within the past year. |
Saugus |
1.5% |
155 of 10,210 Saugus households received food stamps within the past year. |
Swampscott |
1.5% |
80 of 5,457 Swampscott households received food stamps within the past year. |
Topsfield |
3.6% |
40 of 1,126 Topsfield households received food stamps within the past year. |
Gloucester |
1.9% |
247 of 12,906 Gloucester households received food stamps within the past year. |
Haverhill |
1.5% |
362 of 24,155 Haverhill households received food stamps within the past year. |
Ipswich |
0.8% |
15 of 1,832 Ipswich households received food stamps within the past year. |
Lawrence |
2.0% |
510 of 25,807 Lawrence households received food stamps within the past year. |
Lynn |
1.3% |
445 of 32,981 Lynn households received food stamps within the past year. |
Lynnfield |
2.5% |
111 of 4,529 Lynnfield households received food stamps within the past year. |
