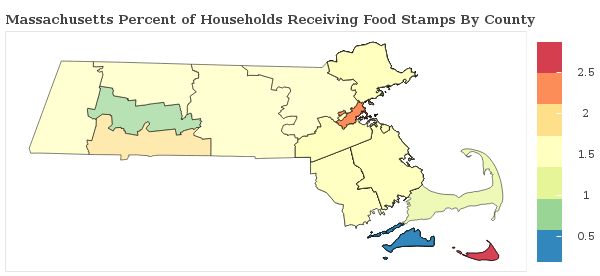
1.6% of Households Receive Food Stamps in Lowell, Massachusetts
Food Stamps in Lowell, Massachusetts
What percent of Households Receive Food Stamps in Lowell?
The percentage of households receiving food stamps in the last year in Lowell is 1.6%.
How Many Households in Lowell Receive Food Stamps?
There are 612 households out of 38965 in Lowell receiving food stamps.
Where does Lowell Rank in Comparison to Other Massachusetts Cities for HouseHolds Receiving Food Stamps?
Lowell ranks 137th out of 224 cities and towns in Massachusetts for the least number of households receiving food stamps. A smaller numeric rank indicates a lower percentage of homes receive food stamps.
How do other cities in Middlesex County compare to Lowell when it comes to the percentage of homes receiving Food Stamps?
Cities must have a minimum of 1,000 residents to qualify
| City | Food Stamps | Details |
|---|---|---|
Malden |
2.8% |
641 of 23,028 Malden households received food stamps within the past year. |
Marlborough |
1.5% |
230 of 15,529 Marlborough households received food stamps within the past year. |
Maynard |
2.1% |
91 of 4,274 Maynard households received food stamps within the past year. |
Medford |
1.2% |
272 of 22,490 Medford households received food stamps within the past year. |
Melrose |
1.4% |
162 of 11,481 Melrose households received food stamps within the past year. |
Newton |
1.3% |
412 of 30,952 Newton households received food stamps within the past year. |
Arlington |
1.6% |
289 of 18,632 Arlington households received food stamps within the past year. |
Ayer |
0.0% |
0 of 1,363 Ayer households received food stamps within the past year. |
Belmont |
1.4% |
136 of 9,728 Belmont households received food stamps within the past year. |
Burlington |
1.1% |
106 of 9,572 Burlington households received food stamps within the past year. |
Cambridge |
1.9% |
848 of 44,234 Cambridge households received food stamps within the past year. |
Cochituate |
1.0% |
26 of 2,494 Cochituate households received food stamps within the past year. |
East Pepperell |
0.0% |
0 of 692 East Pepperell households received food stamps within the past year. |
Everett |
2.4% |
369 of 15,591 Everett households received food stamps within the past year. |
Framingham |
2.0% |
569 of 27,770 Framingham households received food stamps within the past year. |
Pepperell |
1.9% |
19 of 999 Pepperell households received food stamps within the past year. |
Pinehurst |
1.7% |
41 of 2,406 Pinehurst households received food stamps within the past year. |
Reading |
1.9% |
183 of 9,476 Reading households received food stamps within the past year. |
Shirley |
0.0% |
0 of 726 Shirley households received food stamps within the past year. |
Somerville |
1.5% |
503 of 32,453 Somerville households received food stamps within the past year. |
Stoneham |
0.7% |
59 of 9,062 Stoneham households received food stamps within the past year. |
Townsend |
0.0% |
0 of 591 Townsend households received food stamps within the past year. |
Wakefield |
0.7% |
71 of 10,532 Wakefield households received food stamps within the past year. |
Waltham |
2.0% |
463 of 23,722 Waltham households received food stamps within the past year. |
Watertown Town |
1.2% |
185 of 15,160 Watertown Town households received food stamps within the past year. |
West Concord |
0.8% |
21 of 2,574 West Concord households received food stamps within the past year. |
Wilmington |
0.5% |
42 of 7,947 Wilmington households received food stamps within the past year. |
Winchester |
1.1% |
86 of 7,928 Winchester households received food stamps within the past year. |
Woburn |
2.4% |
370 of 15,237 Woburn households received food stamps within the past year. |
Groton |
2.9% |
15 of 514 Groton households received food stamps within the past year. |
Hopkinton |
2.6% |
27 of 1,036 Hopkinton households received food stamps within the past year. |
Hudson |
2.6% |
157 of 6,142 Hudson households received food stamps within the past year. |
Lexington |
1.3% |
153 of 11,755 Lexington households received food stamps within the past year. |
Littleton Common |
1.5% |
18 of 1,206 Littleton Common households received food stamps within the past year. |
Lowell |
1.6% |
612 of 38,965 Lowell households received food stamps within the past year. |
