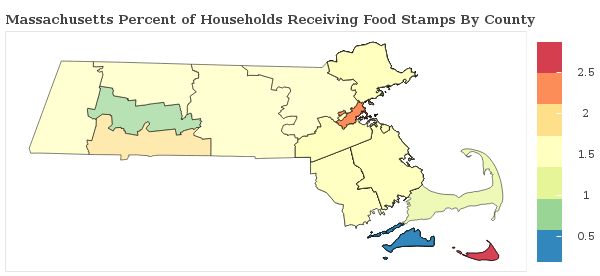
1.7% of Households Receive Food Stamps in Fall River, Massachusetts
Food Stamps in Fall River, Massachusetts
What percent of Households Receive Food Stamps in Fall River?
The percentage of households receiving food stamps in the last year in Fall River is 1.7%.
How Many Households in Fall River Receive Food Stamps?
There are 663 households out of 38611 in Fall River receiving food stamps.
Where does Fall River Rank in Comparison to Other Massachusetts Cities for HouseHolds Receiving Food Stamps?
Fall River ranks 144th out of 224 cities and towns in Massachusetts for the least number of households receiving food stamps. A smaller numeric rank indicates a lower percentage of homes receive food stamps.
How do other cities in Bristol County compare to Fall River when it comes to the percentage of homes receiving Food Stamps?
Cities must have a minimum of 1,000 residents to qualify
| City | Food Stamps | Details |
|---|---|---|
Mansfield Center |
0.3% |
11 of 3,156 Mansfield Center households received food stamps within the past year. |
New Bedford |
2.8% |
1097 of 39,491 New Bedford households received food stamps within the past year. |
Acushnet Center |
0.0% |
0 of 1,223 Acushnet Center households received food stamps within the past year. |
Attleboro |
1.8% |
306 of 17,094 Attleboro households received food stamps within the past year. |
Bliss Corner |
1.7% |
38 of 2,202 Bliss Corner households received food stamps within the past year. |
Fall River |
1.7% |
663 of 38,611 Fall River households received food stamps within the past year. |
North Seekonk |
0.0% |
0 of 1,040 North Seekonk households received food stamps within the past year. |
North Westport |
3.7% |
71 of 1,919 North Westport households received food stamps within the past year. |
Norton Center |
0.0% |
0 of 455 Norton Center households received food stamps within the past year. |
Ocean Grove |
0.0% |
0 of 1,141 Ocean Grove households received food stamps within the past year. |
Raynham Center |
1.0% |
15 of 1,534 Raynham Center households received food stamps within the past year. |
Smith Mills |
3.8% |
75 of 1,975 Smith Mills households received food stamps within the past year. |
Somerset |
1.4% |
99 of 6,995 Somerset households received food stamps within the past year. |
Taunton |
1.5% |
335 of 22,273 Taunton households received food stamps within the past year. |
