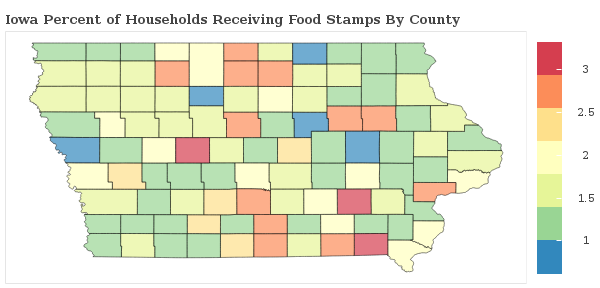
1.4% of Households Receive Food Stamps in Cedar Rapids, Iowa
Food Stamps in Cedar Rapids, Iowa
What percent of Households Receive Food Stamps in Cedar Rapids?
The percentage of households receiving food stamps in the last year in Cedar Rapids is 1.4%.
How Many Households in Cedar Rapids Receive Food Stamps?
There are 747 households out of 54433 in Cedar Rapids receiving food stamps.
Where does Cedar Rapids Rank in Comparison to Other Iowa Cities for HouseHolds Receiving Food Stamps?
Cedar Rapids ranks 142nd out of 291 cities and towns in Iowa for the least number of households receiving food stamps. A smaller numeric rank indicates a lower percentage of homes receive food stamps.
How do other cities in Linn County compare to Cedar Rapids when it comes to the percentage of homes receiving Food Stamps?
Cities must have a minimum of 1,000 residents to qualify
| City | Food Stamps | Details |
|---|---|---|
Cedar Rapids |
1.4% |
747 of 54,433 Cedar Rapids households received food stamps within the past year. |
Center Point |
0.0% |
0 of 885 Center Point households received food stamps within the past year. |
Central City |
4.5% |
25 of 561 Central City households received food stamps within the past year. |
Ely |
2.0% |
15 of 748 Ely households received food stamps within the past year. |
Fairfax |
1.6% |
14 of 896 Fairfax households received food stamps within the past year. |
Hiawatha |
0.1% |
4 of 2,945 Hiawatha households received food stamps within the past year. |
Lisbon |
1.4% |
12 of 857 Lisbon households received food stamps within the past year. |
Marion |
1.4% |
215 of 15,232 Marion households received food stamps within the past year. |
Mount Vernon |
0.0% |
0 of 1,190 Mount Vernon households received food stamps within the past year. |
Palo |
1.2% |
5 of 400 Palo households received food stamps within the past year. |
Robins |
0.3% |
4 of 1,209 Robins households received food stamps within the past year. |
Springville |
1.0% |
5 of 489 Springville households received food stamps within the past year. |
