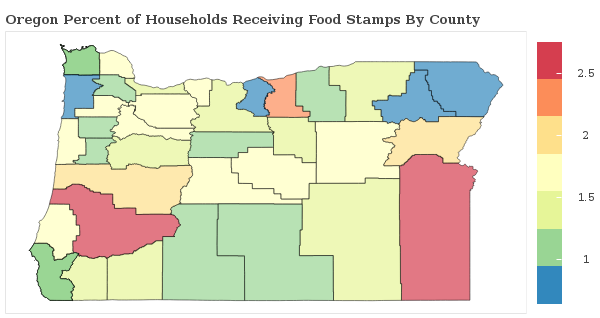
1.8% of Households Receive Food Stamps in Springfield, Oregon
Food Stamps in Springfield, Oregon
What percent of Households Receive Food Stamps in Springfield?
The percentage of households receiving food stamps in the last year in Springfield is 1.8%.
How Many Households in Springfield Receive Food Stamps?
There are 426 households out of 24118 in Springfield receiving food stamps.
Where does Springfield Rank in Comparison to Other Oregon Cities for HouseHolds Receiving Food Stamps?
Springfield ranks 140th out of 210 cities and towns in Oregon for the least number of households receiving food stamps. A smaller numeric rank indicates a lower percentage of homes receive food stamps.
How do other cities in Lane County compare to Springfield when it comes to the percentage of homes receiving Food Stamps?
Cities must have a minimum of 1,000 residents to qualify
| City | Food Stamps | Details |
|---|---|---|
Coburg |
4.6% |
21 of 454 Coburg households received food stamps within the past year. |
Cottage Grove |
2.3% |
94 of 4,022 Cottage Grove households received food stamps within the past year. |
Creswell |
0.3% |
7 of 2,020 Creswell households received food stamps within the past year. |
Dunes City |
2.4% |
14 of 579 Dunes City households received food stamps within the past year. |
Eugene |
1.9% |
1307 of 67,335 Eugene households received food stamps within the past year. |
Florence |
1.8% |
81 of 4,381 Florence households received food stamps within the past year. |
Junction City |
1.0% |
22 of 2,139 Junction City households received food stamps within the past year. |
Lowell |
0.0% |
0 of 445 Lowell households received food stamps within the past year. |
Oakridge |
0.0% |
0 of 1,488 Oakridge households received food stamps within the past year. |
Springfield |
1.8% |
426 of 24,118 Springfield households received food stamps within the past year. |
Veneta |
2.1% |
37 of 1,734 Veneta households received food stamps within the past year. |
